PHP X-Ray in cPanel records real visits to your WordPress site. It shows how much time each plugin and database query takes, so you can see what slows the site down.
X-Ray works in three stages. You start a trace, the site gets some visits, and you read the report. The report lists the slowest requests first and breaks each one down by plugin.
Before you begin
- Turn off any caching plugin on the website, such as LiteSpeed Cache. A cached page skips PHP, so X-Ray has nothing to measure. Turn the plugin back on when you finish.
- Log out of the WordPress dashboard. When you are logged in, WordPress loads extra admin code that your visitors never see, and the results are less accurate.
- Have access to cPanel through your 2MHost client area. See What is cPanel and how to access it.
Start a trace in PHP X-Ray
A trace tells PHP X-Ray to start recording requests (visits) to your website.
- Log in to the client area at www.2mhost.com/login.
- Open Hosting accounts and click the cPanel button of the hosting account. cPanel opens already signed in.
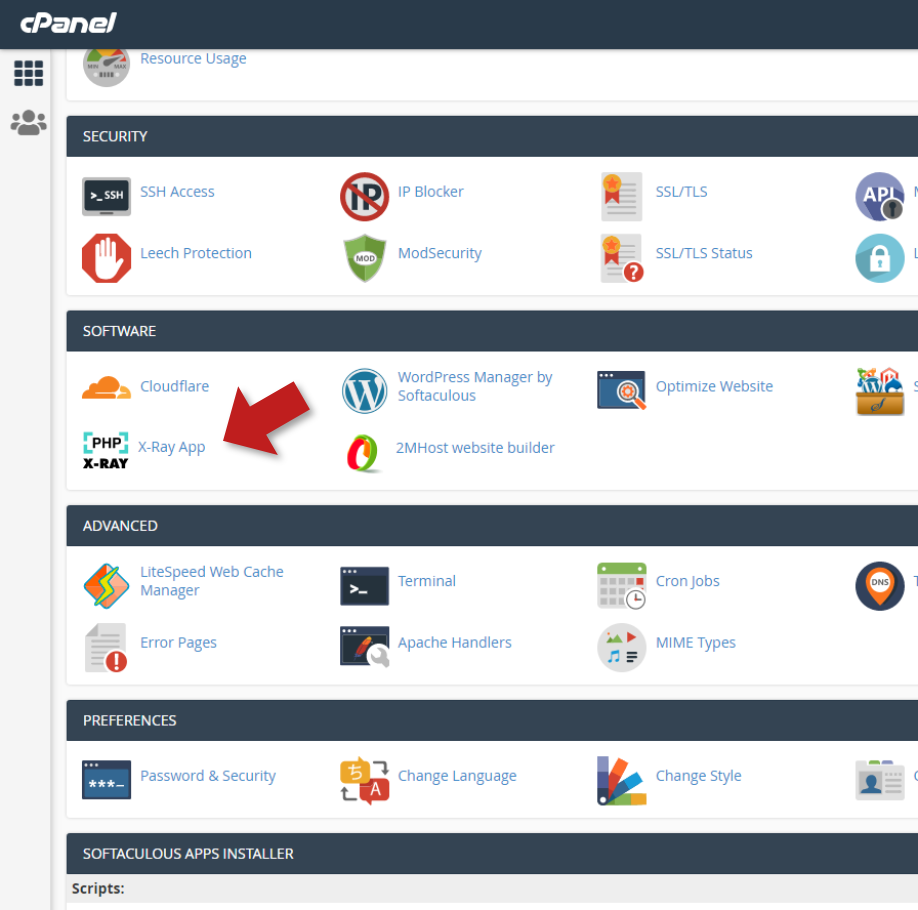
- In cPanel, click the X-Ray App icon.
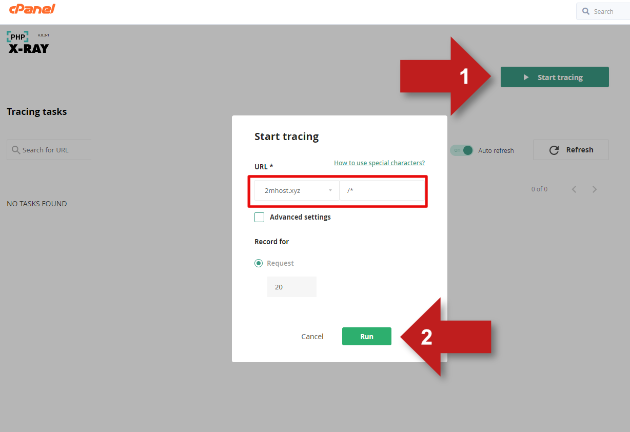
- Click Start tracing.
- Select the domain of the WordPress site.
- In the URL field, enter what to trace:
/*to trace every page of the website.- A folder such as
/blog/*to trace only that part of the site.
- Click Run to start the trace. The trace appears in the list of tasks.
Collect visits to your website
After you start a PHP X-Ray trace, the website needs some visits for X-Ray to record.
- Open the website in a private or incognito browser window, so you browse as a logged-out visitor.
- Open the pages that feel slow, such as the home page, a blog post, the shop or the checkout.
- Wait for the trace to finish. By default, X-Ray stops after 20 visits. On a busy site, regular visitors can fill the trace without your help.
Read the X-Ray report
In cPanel, open PHP X-Ray and click the finished trace to see its report.
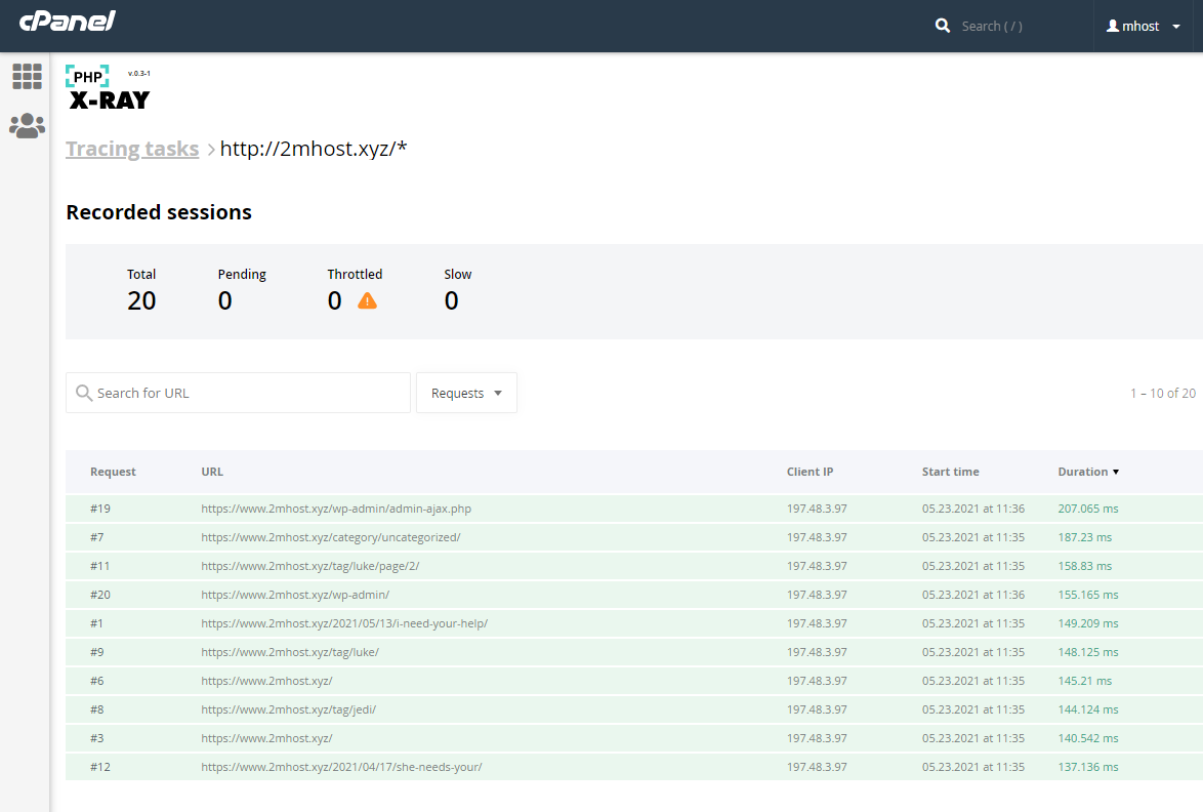
- Review the list of requests. X-Ray orders them by duration, slowest first.
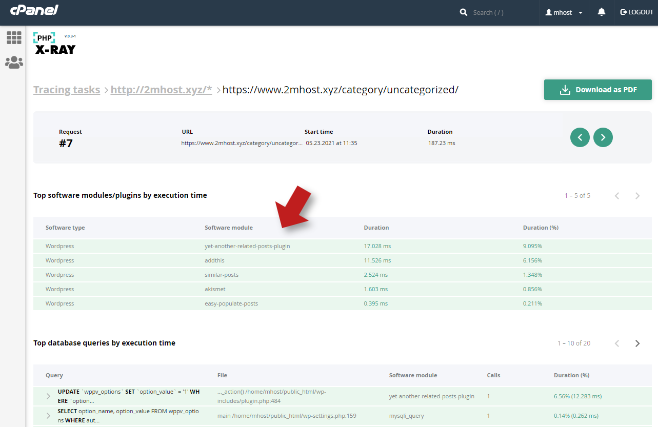
- Click a slow request to see its details. The report shows how much time each WordPress plugin (or module) used. Advanced users can also see the time each MySQL database query took.
- Download the report as a PDF if you want to share it with your website developer.
Fix what the report finds
When one plugin takes most of a request's time, it is the likely cause of the slowness.
- Update the plugin to its latest version, because developers often fix performance problems in updates.
- Deactivate the plugin if the site does not need it, or replace it with a lighter one.
- Send the PDF report to the plugin's developer or your website developer.
When you finish, turn your caching plugin back on.
Troubleshooting
The trace records no requests
Usually a caching plugin is still serving cached pages, or the URL in the trace does not match the pages you visit.
- Turn off the caching plugin in WordPress and clear its cache.
- In cPanel, open X-Ray App and check that the trace uses the right domain and the URL
/*. - Browse the site again in a private browser window.